Build a dashboard for anything
Put live views of your databases on one page: big numbers with a trend, charts, boards and tables for a project, a reading list or a habit.
Every Monday you check the same places: the project board, the reading list, last week's journal. Each is a click or two away, and you never see them together.
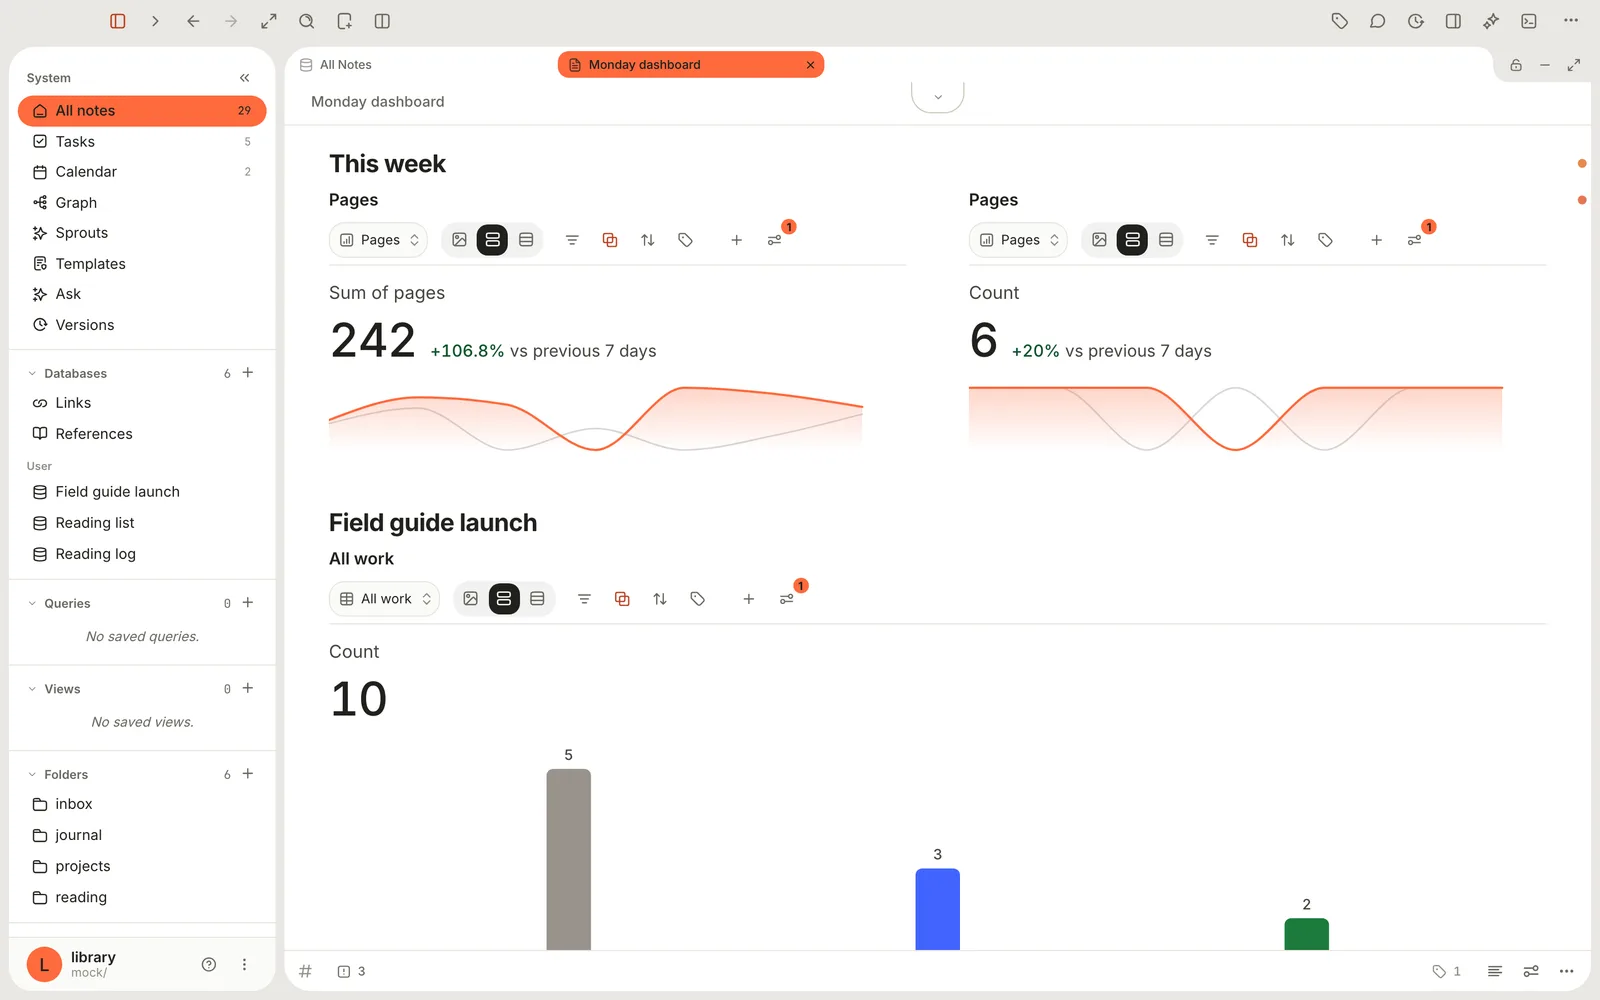
A dashboard puts them on one page. In Terra a dashboard is an ordinary note whose blocks are live views of your databases: a big number with a trend line, a bar chart, a board you can drag cards across, a table. Nothing is copied. Each block reads its database when you open the page.
This guide builds Maya's Monday dashboard: how much she read this week, where her field guide launch stands, and what's on her shelf.
How it fits together
A block is a window onto one database, and it looks through that database's current view: the view the database opens to. So most of what you change in a block is really a change to that view, and it shows up wherever the view does.
| What you change in a block | Where it's kept |
|---|---|
| Filters, sorting, grouping, visible properties | The database's current view. The database and every block that shows it change too. |
| Which view is current (the view menu in the block's header) | The database |
| The layout of the template's four blocks | The block |
| The settings of the template's number and chart blocks (except a chart's X axis, which is its grouping) | The block |
That gives the one rule worth remembering: give each question its own database. A database is a saved rule, not a copy of your notes, so three small databases cost nothing and never fight over filters. Maya's dashboard reads three:
| Database | Collects | On the dashboard |
|---|---|---|
| Field guide launch | Notes in projects/field-guide | A bar chart by status, and a board |
| Reading list | Notes whose type is book | A table of books with author, shelf and pages |
| Reading log | Daily log notes, tagged #journal, each with the pages read that day | Two numbers: pages read and days read this week |
Step 1Make a database for each question
Build the databases first, the way you want to see them. Blocks pick them up as they are.
- In the sidebar, point at Databases and click + (New database).
- Name it Reading list. Click + (Add condition), set type · is ·
book, and click Save. - Make Reading log the same way, with the condition tags · contains ·
journal. Notes made from the Daily log template carry that tag. - Add the properties each question needs. In the Reading log's table, click + at the right end of the header row (Add property), choose New property, type
pagesand click Number. Give each day a number. The reading list gets ashelfproperty (Select, with To read, Reading and Finished). - Give the Reading log a chart view. Open the view menu at the top of the database (it shows the current view's name) and choose Add view. Click the Chart layout and name the view Pages. On the Chart tab, set Y axis to Sum and Of to
pages, then click Save view.
The new view is now the Reading log's current view. You'll see why that matters in step 3.
Step 2Start from the Dashboard template
The Dashboard template gives you four blocks to start with: a number, a bar chart, a table and a board. Each asks which database to show.
Click New… in the toolbar and choose New from template… (or press ⇧⌘N).
Click Dashboard. A note called Dashboard opens with four pickers: Number view, Chart view, Table view and Board view.
In Number view, click Reading log. Type a few letters in Search databases… to shorten the list.
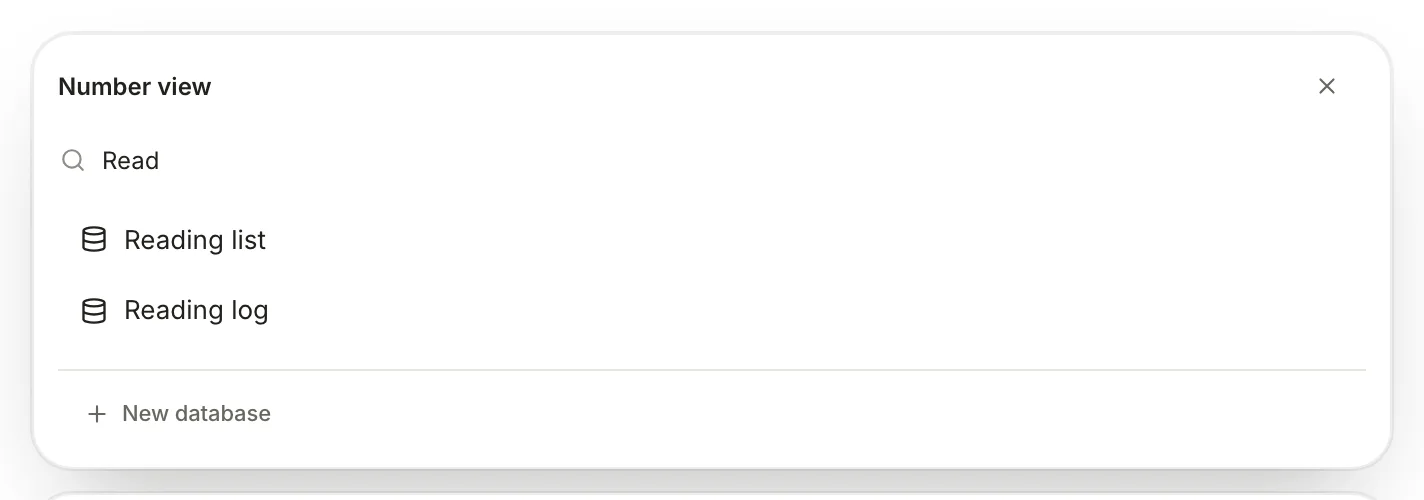
Each block asks for a database. Type to narrow the list; New database makes one on the spot. In Chart view and Board view, click Field guide launch. In Table view, click Reading list.
Click the title, type Monday dashboard and press Return.
Two blocks can share a database, as the chart and board do here. With no grouping set, a chart or board groups notes by your Library's first Status property, so the field guide gets a bar and a column for each of Not started, In progress and Done.
Step 3Show this week's pages, with a trend
A plain total of every page you've ever logged isn't much use on a Monday. A number for the last seven days, with the change from the seven before, is.
The Number block already reads Sum of pages: it starts from the chart settings of the Reading log's current view, the Pages chart you made in step 1.
- Click View preferences at the right end of the Number block's header. A panel opens.
- Click Chart in the panel's list.
- Set Compare to Previous period. Two more rows appear: Date, which starts on the day each note was created (right for a daily log), and Window.
- Set Window to Last 7 days, then close the panel.
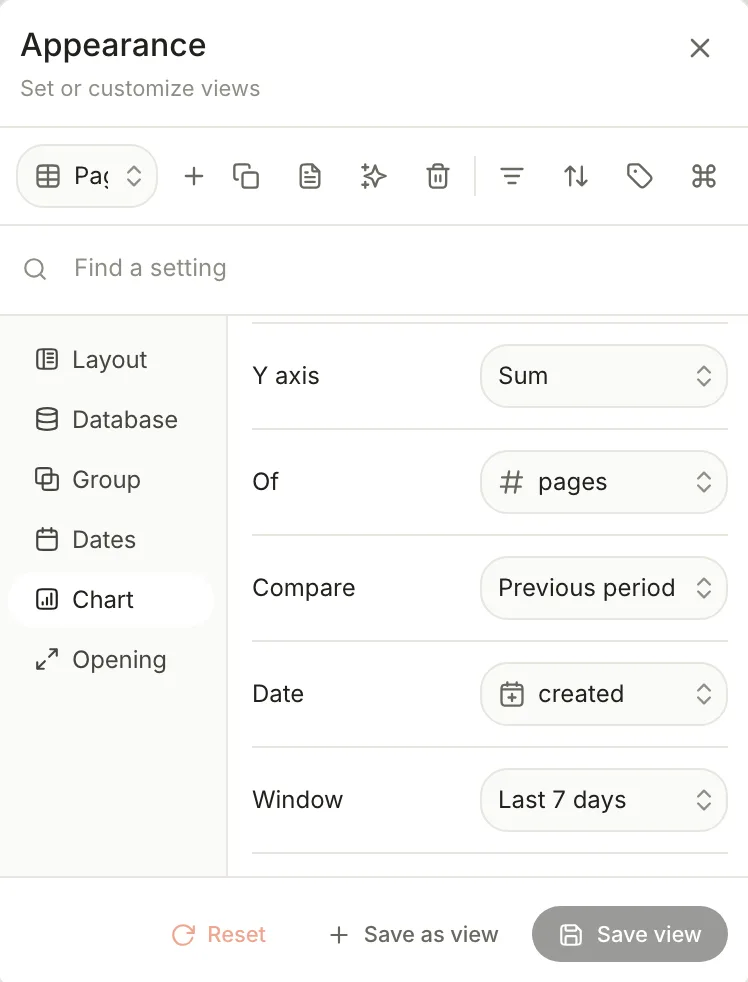
The block now shows the pages read in the last seven days, the change against the previous seven (+106.8% vs previous 7 days), and a small line of the two weeks. These settings belong to this block alone: the Reading log's Pages view is unchanged.
Step 4Add a second number, side by side
A dashboard reads faster when related numbers sit in a row. Maya wants the days she read next to the pages.
Point at the Number block. A grip (⠿) appears to the left of its title. Click it and choose Duplicate.
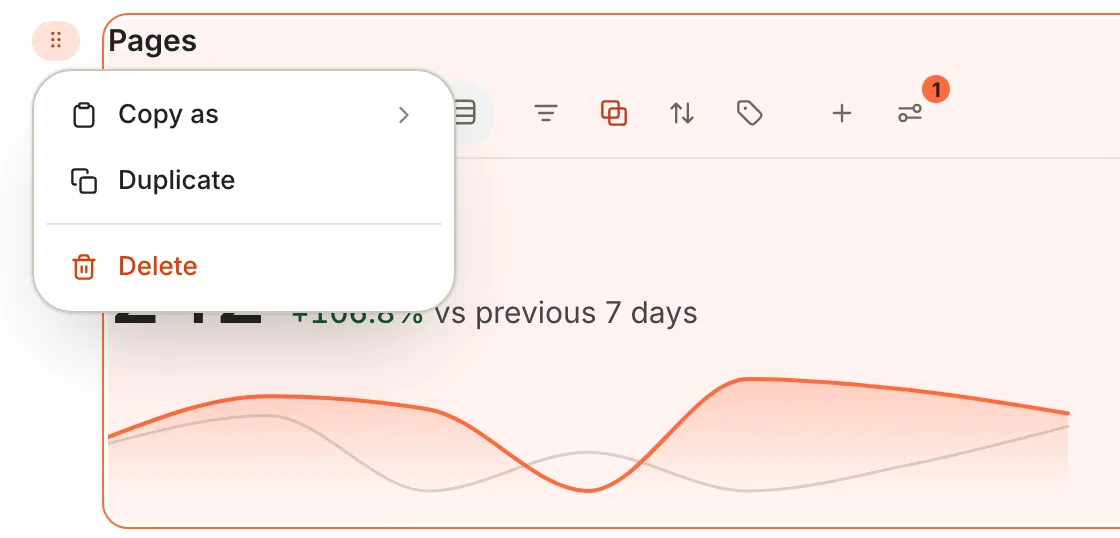
Every block has this menu. Duplicate copies the block with its settings. In the copy, open View preferences › Chart and set Y axis to Count. It now counts the days you logged, with the same comparison.
Drag the copy's grip onto the right edge of the first block, about halfway down. A vertical line shows where it will land. Let go, and the two sit side by side.
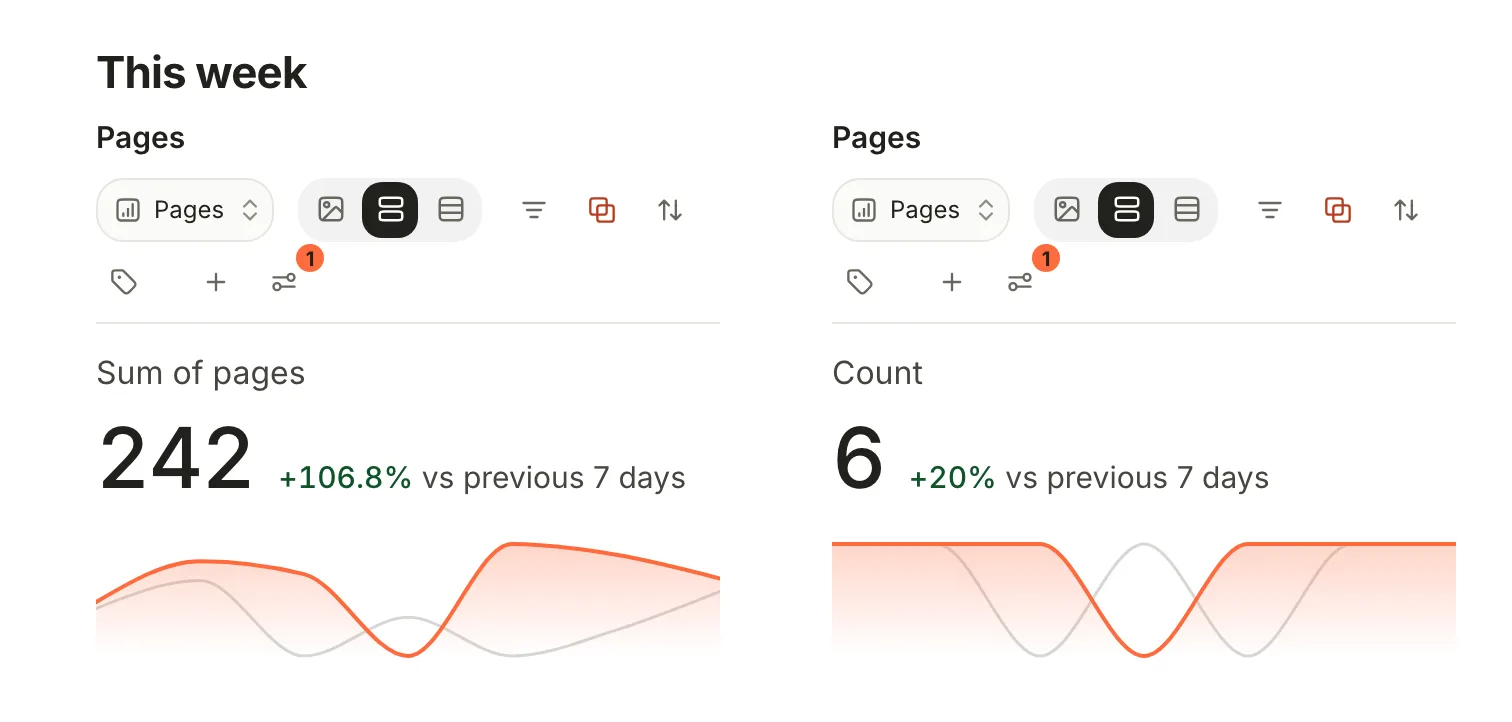
Two numbers in columns. Both read the Reading log; each keeps its own settings. To change the split, drag the gap between the columns. Widths snap at quarters, thirds and halves; double-click the gap to even them out.
A row holds up to four columns. Columns sit at the top level of a note, not inside tabs, and they stack when the window is too narrow for them.
Step 5Work the project from the dashboard
The chart and the board are the same notes seen two ways, and both are live.
- Move work along: drag a card on the board to another column. Terra writes the new status into the note.
- See what's behind a bar: click it to list its notes under the chart. Click a note to open it.
- Open a note: click a card or a row. It opens the way the view is set to open notes (View preferences › Opening), beside the dashboard by default.
- Regroup: Group by in a block's header (Show boards as on a board) changes the grouping of the database's current view, so the chart and the board change together.
Changes you make inside a block show in that block straight away. The other blocks catch up the next time you open the dashboard.
Step 6Add more with /database
Any database can join the page, including the built-in ones. Maya adds her checkbox tasks.
Click at the end of the last line and press Return.
Type
/databaseand press Return. The Insert database picker opens, listing each database with the layout of its current view.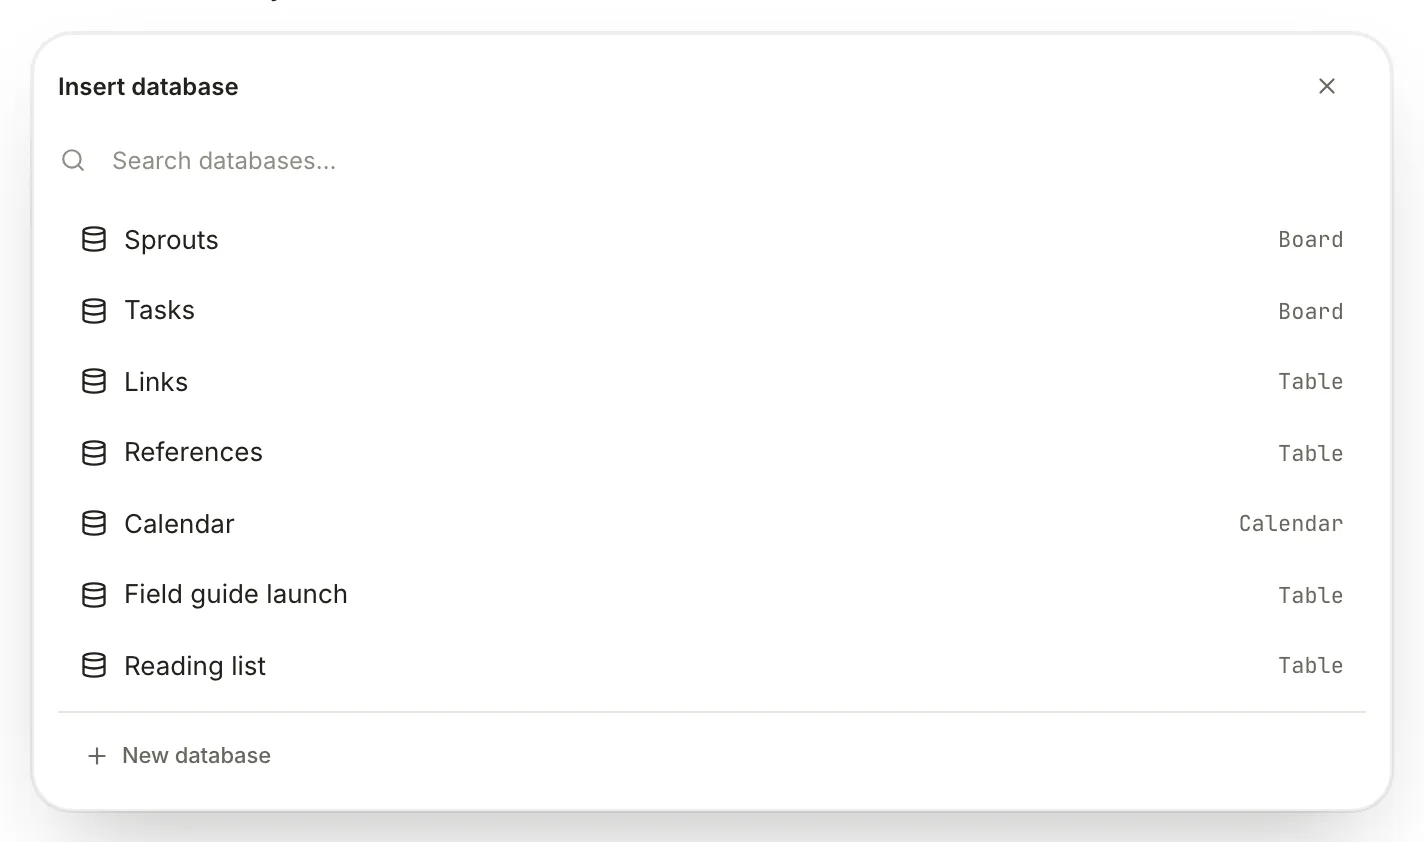
A /database block shows the database through its current view, in that view's layout. Click Tasks. Your task board appears in the note.
A block inserted this way keeps no layout of its own. To show it differently, change its database's current view (from the block's View preferences, or in the database itself). The block switches the next time you open the dashboard.
Step 7Keep it fast
Every block runs its database when the dashboard opens. A few habits keep a busy page quick.
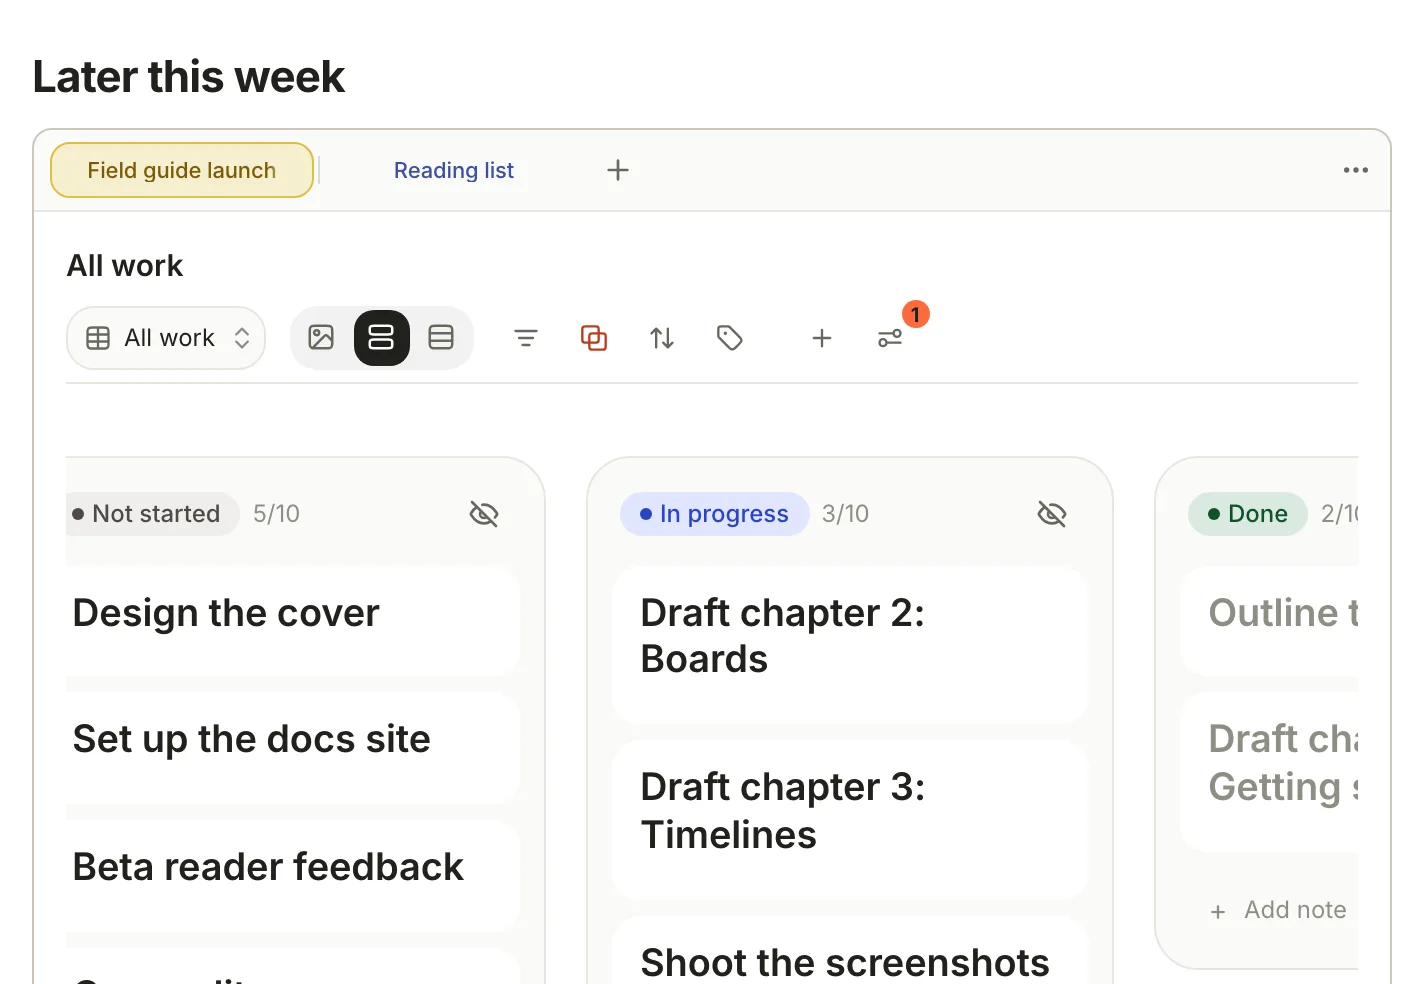
Put what you don't need at a glance in tabs. A block in a tab that isn't showing doesn't load until you open that tab. To turn sections into tabs, select from a heading down through the sections after it, then choose Turn into › Tabs from sections in the editor toolbar. Each heading becomes a tab.
Keep database rules lean. Conditions on tags, folders, types and properties come straight from Terra's index. A Note Body condition makes Terra read every note's file each time the database opens. The Database tab of View preferences shows what a rule costs, as 12 notes · 4 ms; for a rule written in SQL, turn on Cache the result and use Refresh now when you want fresh numbers.
Skip the entrance animation. Charts draw themselves in over about a second the first time they appear. To show them at once, set Settings › Appearance › Animations to Reduced or Off.
Features you might have missed
Give the dashboard room
Click Reader preferences at the bottom of the note and use the arrows beside Width to pick Wide or Full width. Turn on Remember for this note so only the dashboard gets wider.
A snapshot for your weekly review
In a block's View preferences, Save as Markdown note freezes the current view into a dated note in your Inbox, as a table of up to 1,000 rows. Save the view first if the button reads Save the view to snapshot it.
Reuse the layout
Right-click the dashboard in the note list and choose Save as template…. Next quarter's dashboard is then one pick in New from template…, with every block waiting for its database. See Templates.
Make a database from the picker
Every picker ends in New database. Type a name and click Create database: the database appears in the sidebar and in the block. Its rule starts empty, so it shows every note until you set one on the block's Database tab.
Keep it one click away
Click Add to Favorites (the flag) in the editor toolbar. Or put the dashboard on the toolbar: right-click any toolbar button, choose Customize toolbar…, find it among the recent notes in the Command library, drag it onto the toolbar and click Apply.
Troubleshooting
I changed one block and another changed too
Filters, sorting and grouping belong to the database's current view, which every block of that database shares. Give the question its own database instead; see How it fits together.
I picked a new layout, but the block didn't change
The template's four blocks keep their own layout, whatever the view says. A block added with /database follows its database's current view, and switches the next time you open the dashboard.
There's no Chart tab in View preferences
The Chart tab appears only while the block's database has a chart as its current view. Add a Chart view to the database, or pick an existing one from the view menu in the block's header.
The number shows 0, or doesn't move
With Compare on, a number counts only notes whose Date falls inside the Window, which ends today. Check that Date is the right property and the window is wide enough.
"Database not found"
The block's database was deleted or moved. Click Pick another to point the block at a different database, or Remove to delete the block.
Boards or cards show up as tables
A view kind can be switched off for the whole Library. Check Settings › Features: Kanban controls boards and Gallery controls cards.
What's next
- Run a project with boards, timelines and burndowns: build the views your dashboard shows.
- Views and layouts: every layout a view can use.
- Filter, sort and group: shape what each database shows.
- Templates: turn a finished dashboard into a starting point.
Was this guide helpful?