# Run a project with boards, timelines and burndowns
> Track a project's work as notes, then see it as a kanban board, a Gantt-style timeline, progress charts and a dashboard — plus an honest recipe for a burndown.
Source: https://terramd.io/docs/project-suite
Projects don't fail for lack of a plan. They fail when the plan lives in one place, the work in another and the status in someone's head.
In Terra, every piece of work is a note — the draft, the decisions, the links — and the project plan is just a different way of looking at those notes. Group them by status and you have a kanban board. Lay them along their dates and you have a timeline. Count them and you have a progress chart. Change a card on the board and the note changes with it, because it *is* the note.
This guide builds a complete project suite for a real-sized example: launching a field guide in five weeks with two collaborators, Sam and Ines.
> [!SUMMARY]
> - Give the project a folder and a database that collects its work
> - Add the properties every view runs on: status, owner, start, due, effort
> - Build a kanban board, a timeline and progress charts as views of the same notes
> - Bring it all onto one dashboard note
> - Chart a burndown of remaining work over time
> [!BEFORE]
> - A Library open in Terra. New to Terra? Start with the [Quickstart](https://terramd.io/docs/quickstart).
> - A rough list of the project's pieces of work. You can add more as you go.
> - About 30 minutes. The burndown at the end takes another 10.
## How it fits together
Four ideas carry the whole guide:
- **Work items are notes.** "Draft chapter 2" is a note in the project's folder. Its notes, links and checklists live inside it.
- **Properties describe them.** Each note carries a few [properties](https://terramd.io/docs/properties) — `status`, `owner`, `start`, `due`, `effort` — stored in the note's front matter. Every board, timeline and chart is built from these.
- **A database collects them.** A [*database*](https://terramd.io/docs/databases) is a live list of notes that match a rule, such as "everything in the `projects/field-guide` folder". It doesn't move or copy anything; notes join and leave it as they change.
- **Views show them.** A database can have many saved [*views*](https://terramd.io/docs/views-and-layouts), each with its own layout:
| You want to see | Use a view with layout | Built from |
| --- | --- | --- |
| Who's doing what, and what's stuck | **Board** | `status` (or any property you group by) |
| What happens when | **Timeline** | `start` and `due` |
| How far along you are | **Chart** | Counts or sums, grouped by `status` |
| Everything, editable | **Table** | All of them |
| Remaining work over time | A **query** chart | A `completed` date you record |
## Step 1: Give the project a home
Keep every piece of work for the project in one folder. It makes the database rule simple, and it means the project's files stay together on disk.
1. In the sidebar, under **Folders**, right-click **projects** (or any folder) and choose **New subfolder**. Name it `field-guide` and click **Save**.
2. Point at the new folder in the sidebar and click **New note here**. Name the note after a piece of work: *Outline the field guide*.
3. Repeat for each piece of work — *Draft chapter 1*, *Design the cover*, *Copy edit*, and so on. One note per thing someone can finish.
> [!TIP] Size work items so they finish
> A good work item takes between a day and a week, and has one owner. "Write the book" is a project; "Draft chapter 2: Boards" is a work item. Small items make boards honest and burndowns smooth.
## Step 2: Create the project's database
1. In the sidebar, point at **Databases** and click **+** (**New database**).
2. Type a name: *Field guide launch*.
3. Click **+** (**Add condition**). Set the condition to **Folder** · **starts with** · `projects/field-guide`.
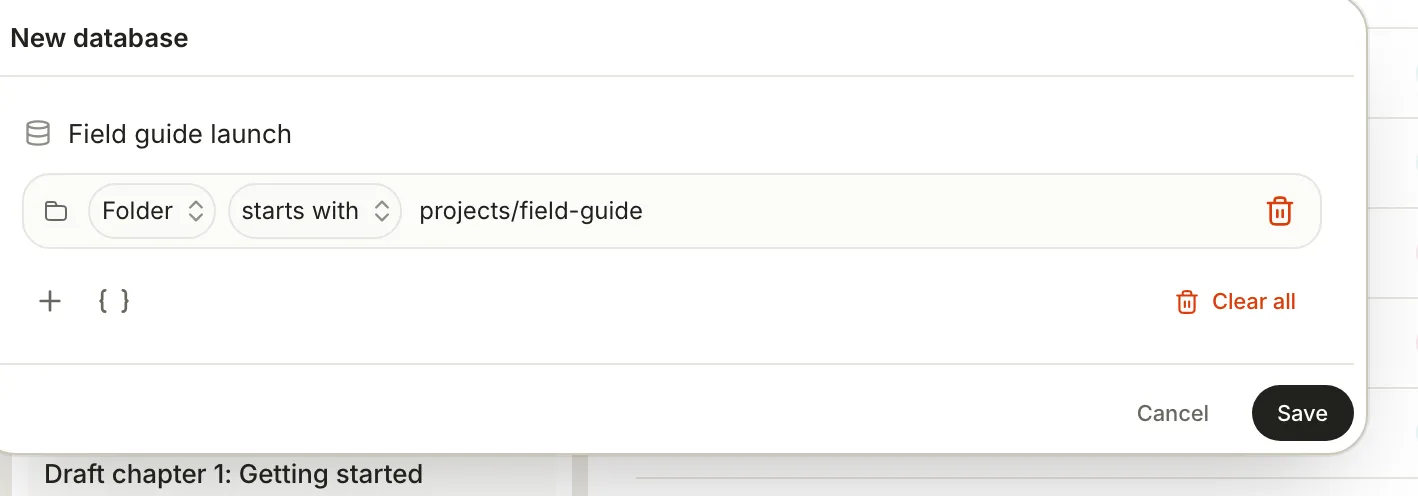
4. Click **Save**. The database opens as a table, with **View preferences** open beside it. It also appears in the sidebar under **Databases**, in the **User** group.
Prefer tags to folders? Use **tags** · **contains** · `field-guide` instead, and tag each work item. Either way, the rule lives on the **Database** tab of **View preferences** and you can change it later.
## Step 3: Add the properties every view runs on
Five properties are enough to run a serious project. Add them once and every view can use them.
| Property | Type | What it's for |
| --- | --- | --- |
| `status` | **Status** | Board columns, progress charts, timeline progress |
| `owner` | **Select** | Who's on it — options *Maya*, *Sam*, *Ines* |
| `start` | **Date** | When work begins (timeline bars) |
| `due` | **Date** | When it should finish (timeline bars, due-date charts) |
| `effort` | **Number** | Rough size in days — weights charts and progress |
1. In the table, click **+** at the right end of the header row (**Add property**), then **New property**.
2. Type the name — `status` — and click the type, **Status**.
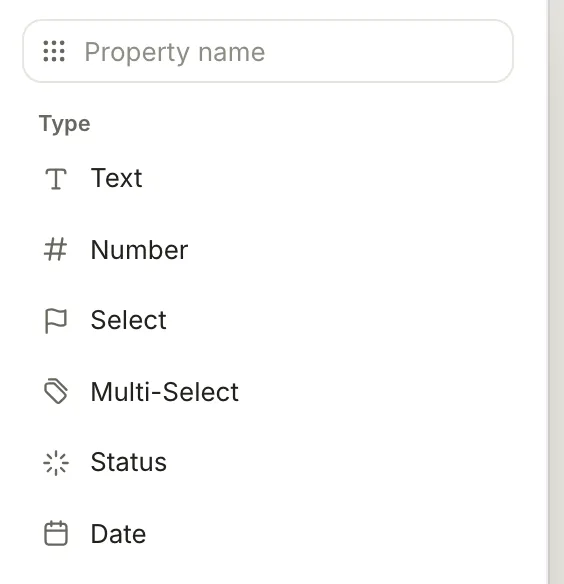
3. Repeat for `owner` (**Select**), `start` and `due` (**Date**) and `effort` (**Number**).
4. Fill in the values right in the table: click a cell and pick or type. A new **Status** property comes with three options — *Not started*, *In progress* and *Done* — which is all most projects need.
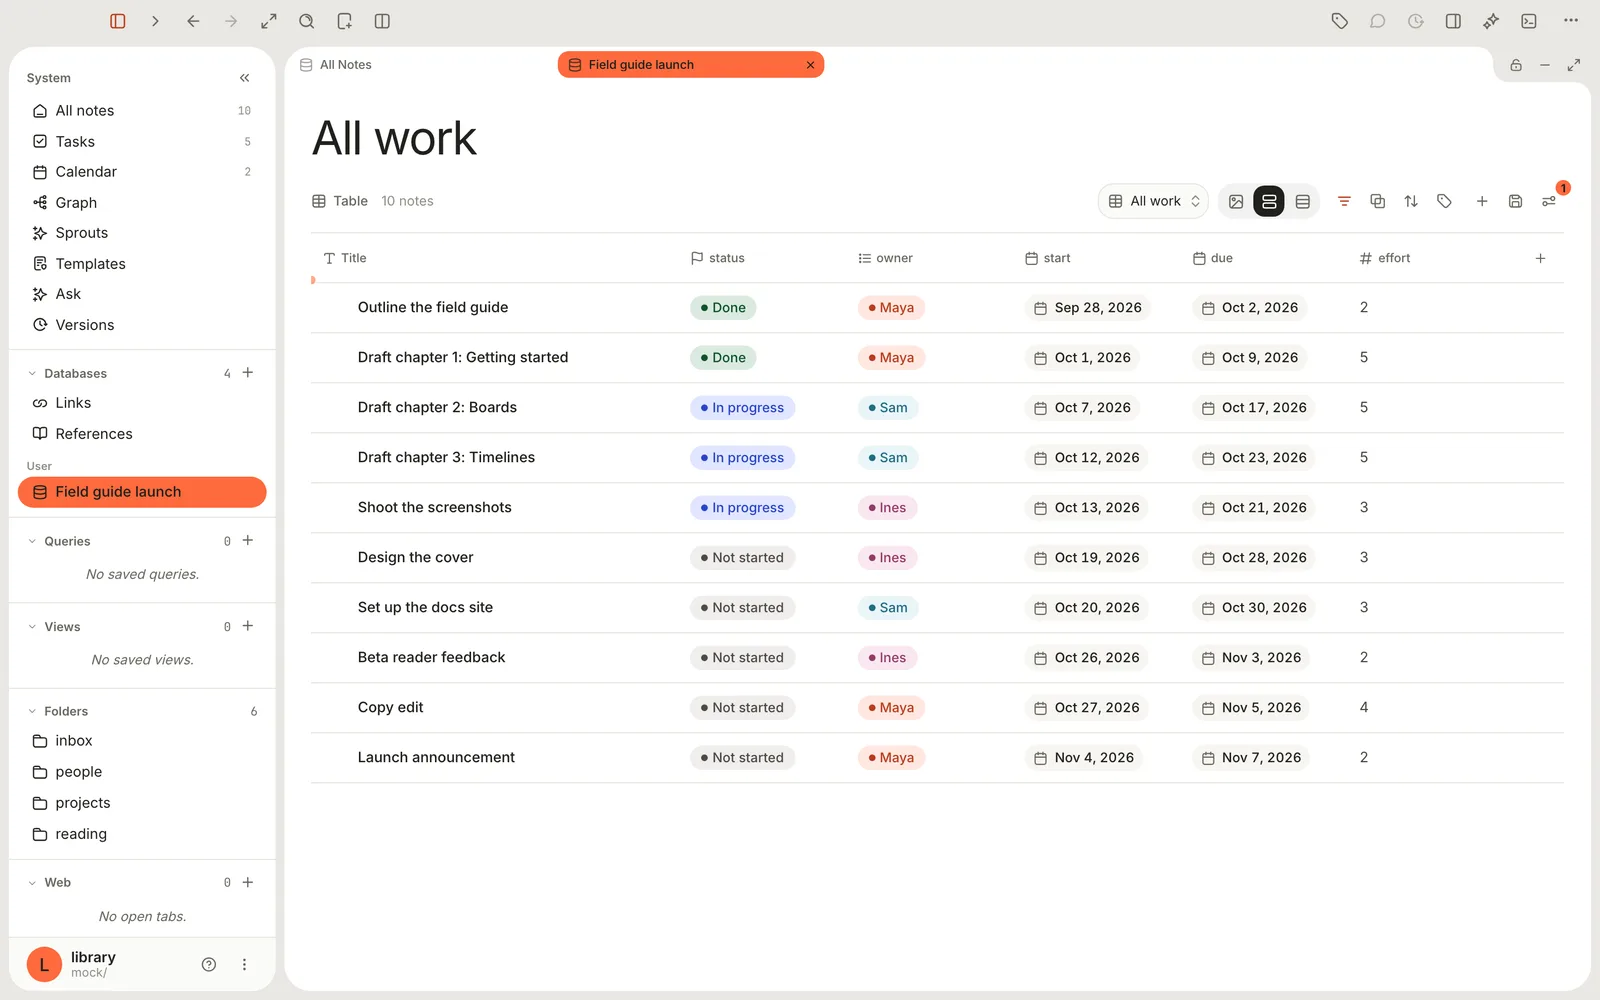
> [!NOTE] Call the status property `status`
> Terra lowercases property names. Keep the status property's name exactly `status` and its finished option *Done* — the timeline's progress bars look for those words. To rename options or change their colours, open **Tools › Property Manager…**.
## Step 4: Build the kanban board
A board shows each work item as a card in a column — one column per status — so the state of the project is visible at a glance.
1. At the top of the database, click the view menu (it shows the current view's name, **All work** here) and choose **Add view**. **View preferences** opens on the **Layout** tab.
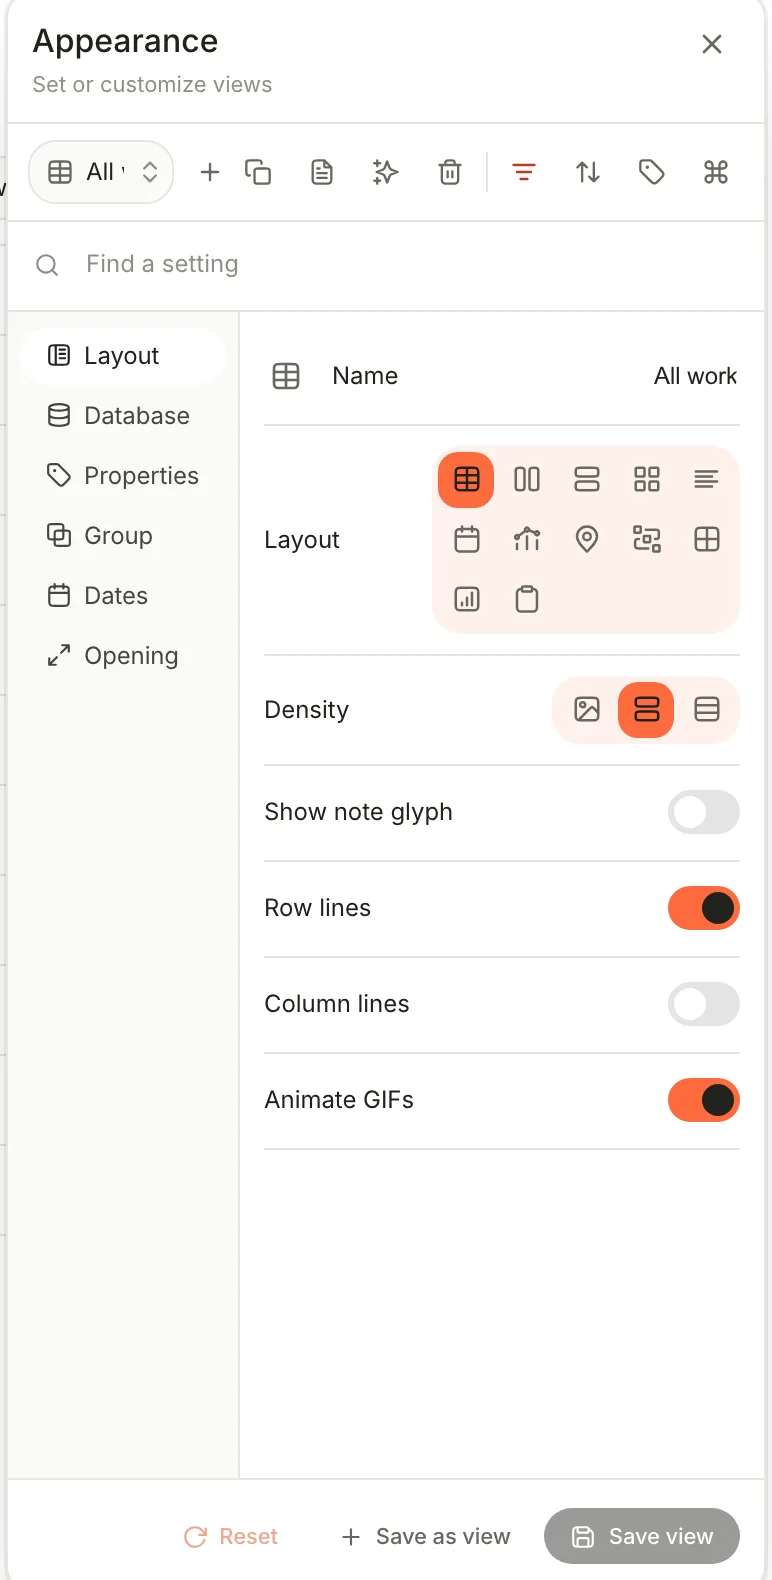
2. Click the **Board** layout (the two-column icon), type **Board** in **Name**, and click **Save view**.
3. Close the panel. Terra groups the cards by your first Status property, so you get **Not started**, **In progress** and **Done** columns. Each column shows how many cards it holds out of the whole board — *3/10*.
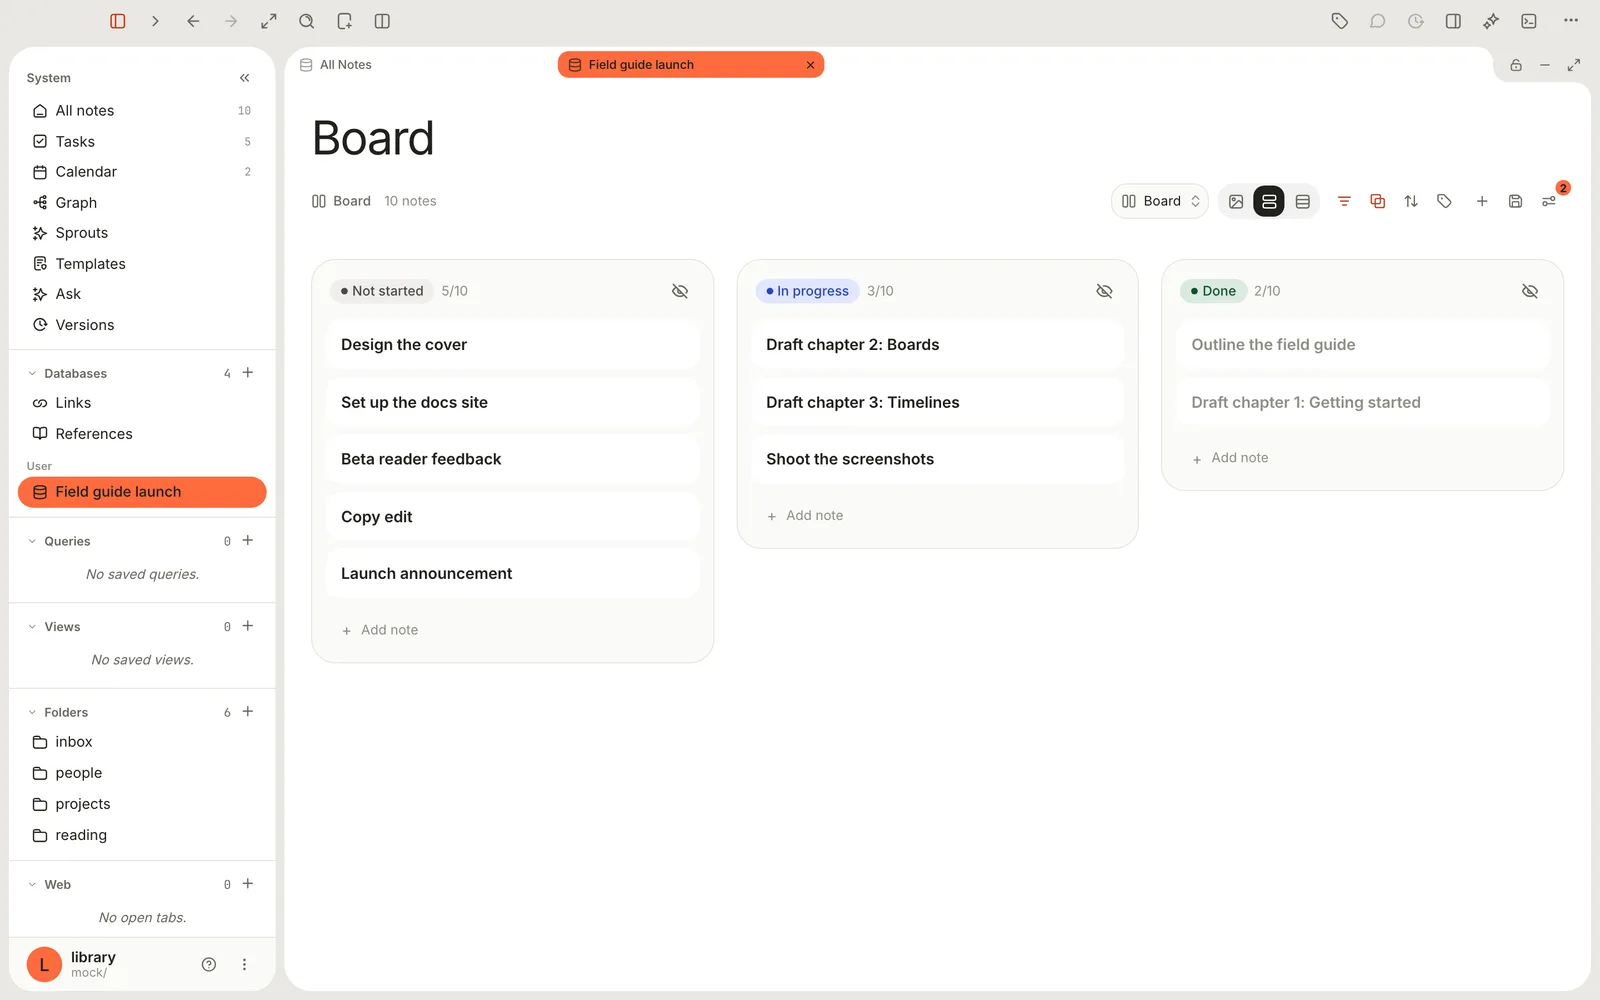
Now run the project from here:
- **Move work forward:** drag a card to another column. Terra writes the new status into the note.
- **Open a card:** click it to read or edit the note beside the board.
- **Show more on cards:** click **Properties** in the header and tick `owner`, `due` and `effort`; drag them to reorder.
- **Group by something else:** click **Show boards as** and pick another property — `owner` turns the board into a who's-doing-what view.
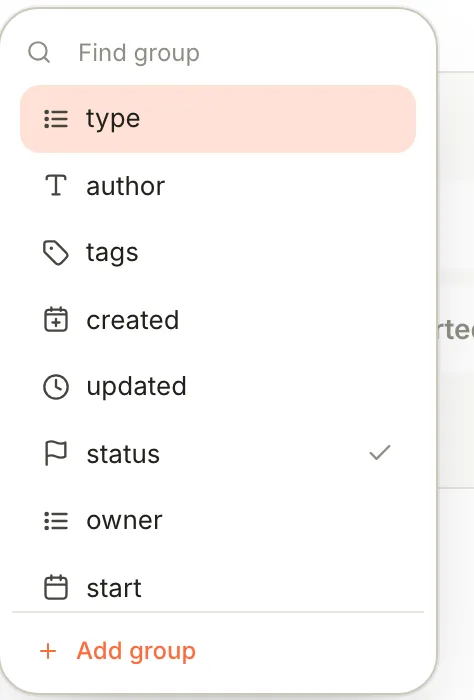
- **Collapse to three columns:** if your status property has many options, open **View preferences › Group** and set **Group status by** to **Group**. You get **To do**, **In progress** and **Done**.
- **Hide a column:** click the eye icon in its header. Bring it back from **View preferences › Group › Hidden groups**.
> [!WARNING] Add new work from the folder, not the board
> **+ Add note** at the foot of a column creates the note in your **Inbox**. Because this database collects notes from the project folder, the new card disappears from the board until you move the note into `projects/field-guide`. To add work, use **New note here** on the folder in the sidebar instead.
## Step 5: Lay out the timeline
The timeline answers "what happens when" and shows where work overlaps.
1. Open the view menu and choose **Add view**. Pick the **Timeline** layout, name it **Timeline**.
2. In **View preferences**, click the **Dates** tab. Set **Start** to `start` and **End** to `due`.
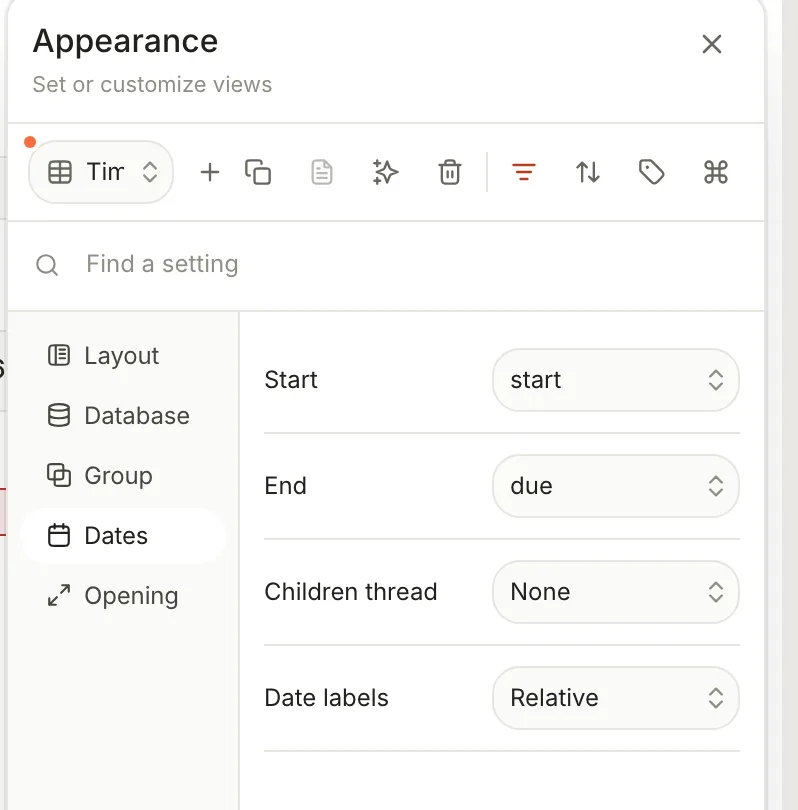
3. Click **Save view**. Each work item becomes a bar from its start date to its due date, with a line marking today.
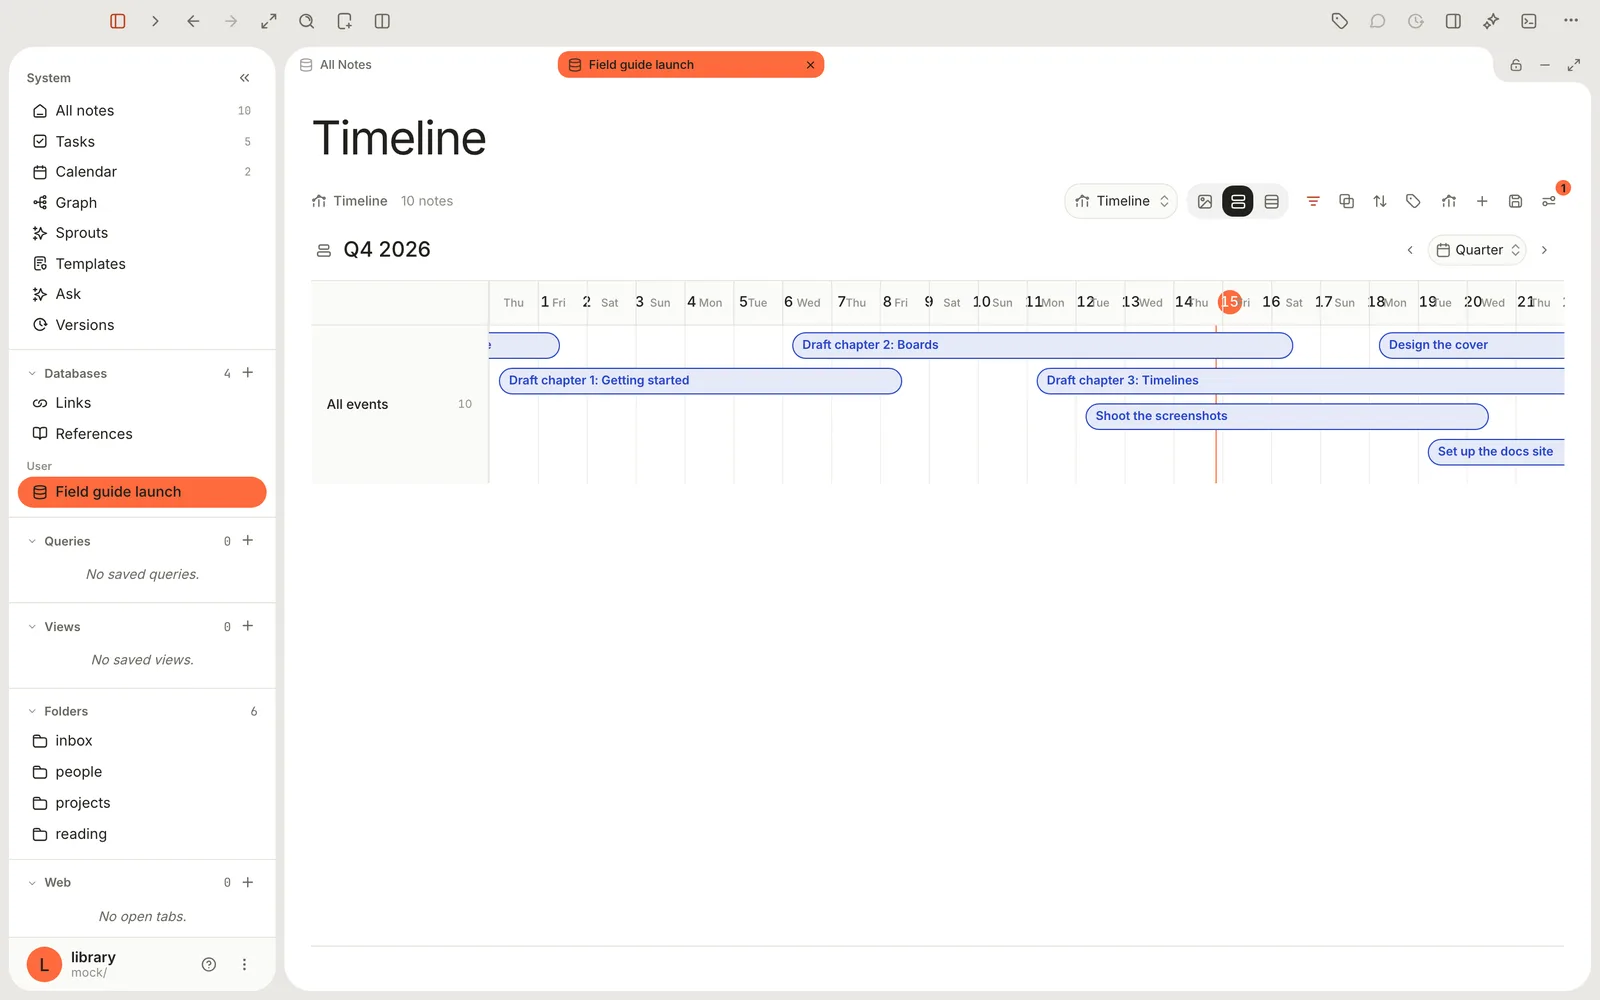
Working with the timeline:
- **Zoom:** use the zoom menu at the top right — **Day**, **Week**, **Month**, **Quarter** or **Year** — and the arrows to move to the previous or next range. Scroll sideways to load more time.
- **Reschedule:** drag a bar left or right. Its start and due dates move together and are written to the note.
- **Details:** click a bar to see the item, open its note, or delete it.
- **Swimlanes:** group the view by `status` (in **Group by**) to get one lane per status.
> [!NOTE]- What the timeline doesn't do yet
> Bars can't be resized by dragging their ends — edit `start` or `due` in the table instead. There are no dependency arrows between bars. Swimlanes work for status, folder, type, tags and the created and updated dates. And the timeline is for notes: checkbox tasks with due dates appear on the **Calendar** instead (see [Run your week with tasks](https://terramd.io/docs/run-your-week-with-tasks)).
## Step 6: Chart your progress
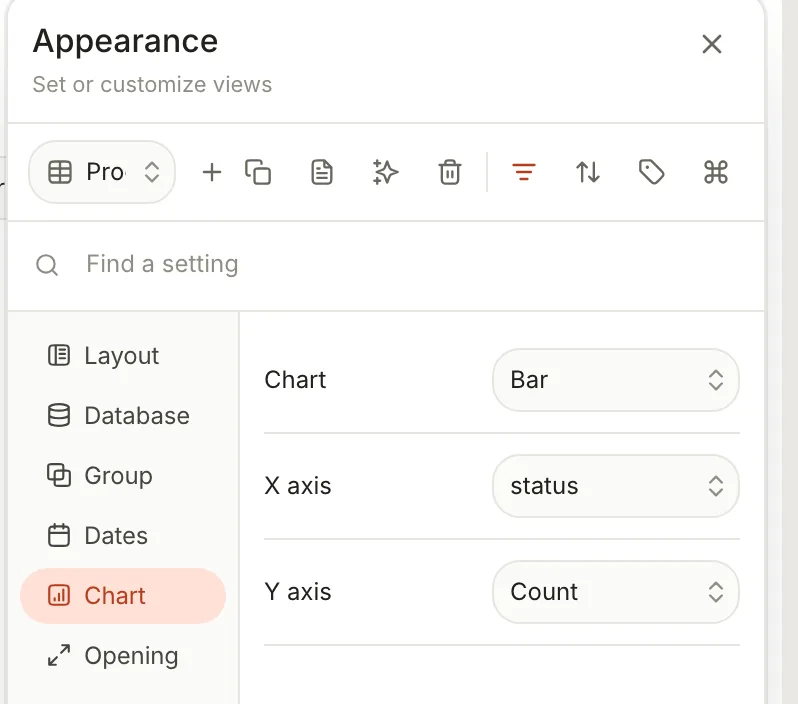
Charts turn the same properties into answers. Add a view with the **Chart** layout, then shape it on the **Chart** tab of **View preferences**:
- **Chart** — **Bar**, **Horizontal bar**, **Line**, **Donut** or **Number** (a single big figure).
- **X axis** — what to group by, such as `status`, `owner` or `due`. For dates, pick a **Bucket**: **Day**, **Week**, **Month**, **Quarter** or **Year**.
- **Y axis** — **Count** of items, or **Sum**, **Average**, **Min** or **Max** **Of** a number such as `effort`.
Three charts worth making for any project:
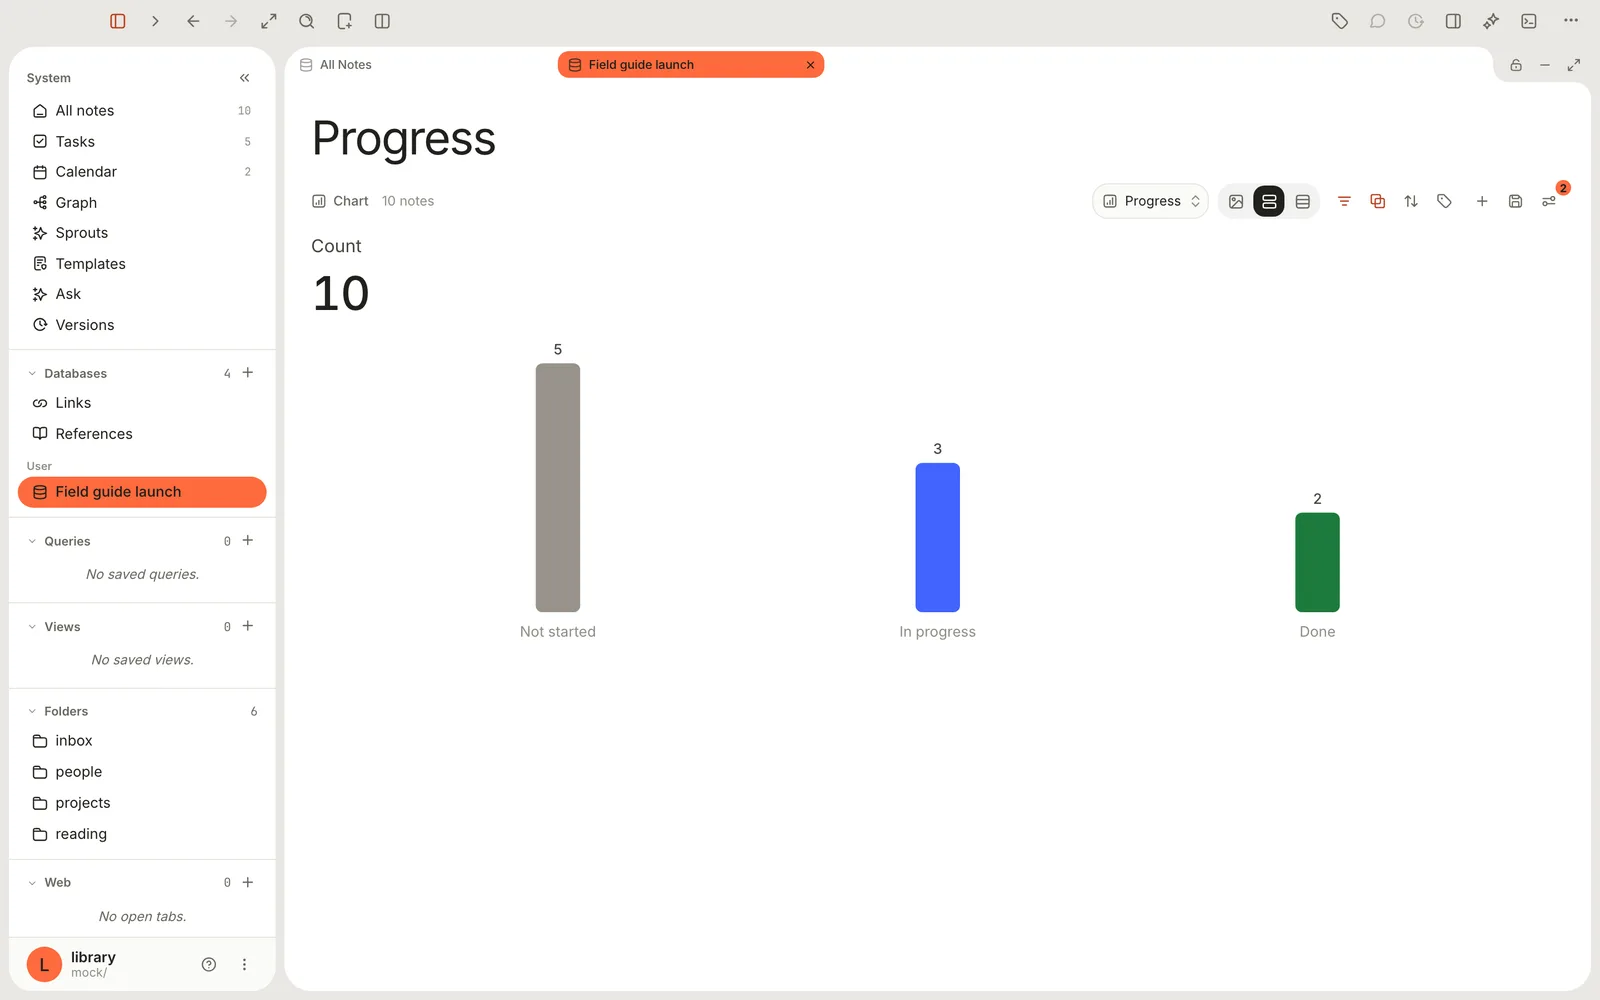
1. **Where are we?** — Chart **Donut** or **Bar**, X axis `status`, Y axis **Count**. Click a bar to list the items in it.
2. **What's still due, and when?** — Click **Filters** and add `status` **is not in group** **Done**. Then Chart **Bar**, X axis `due` with **Bucket** **Week**, Y axis **Sum** **Of** `effort`. You get the remaining work, week by week — a forward-looking cousin of the burndown.
3. **Did we finish anything this week?** — Filter `status` **is in group** **Done**, Chart **Number**, **Compare** **Previous period**, **Date** `completed` (see step 8), **Window** **Last 7 days**. The tile shows this week's count against last week's, with a small trend line.
> [!TIP] Filter by status group, not by name
> `status` **is not in group** **Done** keeps working even if you rename or add options later, because it tests the group (To do, In progress or Done) rather than the option's name.
## Step 7: Put it all on one dashboard
A dashboard is an ordinary note that holds live views of your databases — so the board, the chart and the key numbers sit on one page you can pin, link or open in a split.
1. Click **New…** in the toolbar and choose **New from template…**.
2. Pick **Dashboard** — "A count, a chart, a table, and a board on one page."
3. The note has four blocks: a number, a chart, a table and a board. In each block's picker, choose **Field guide launch**.
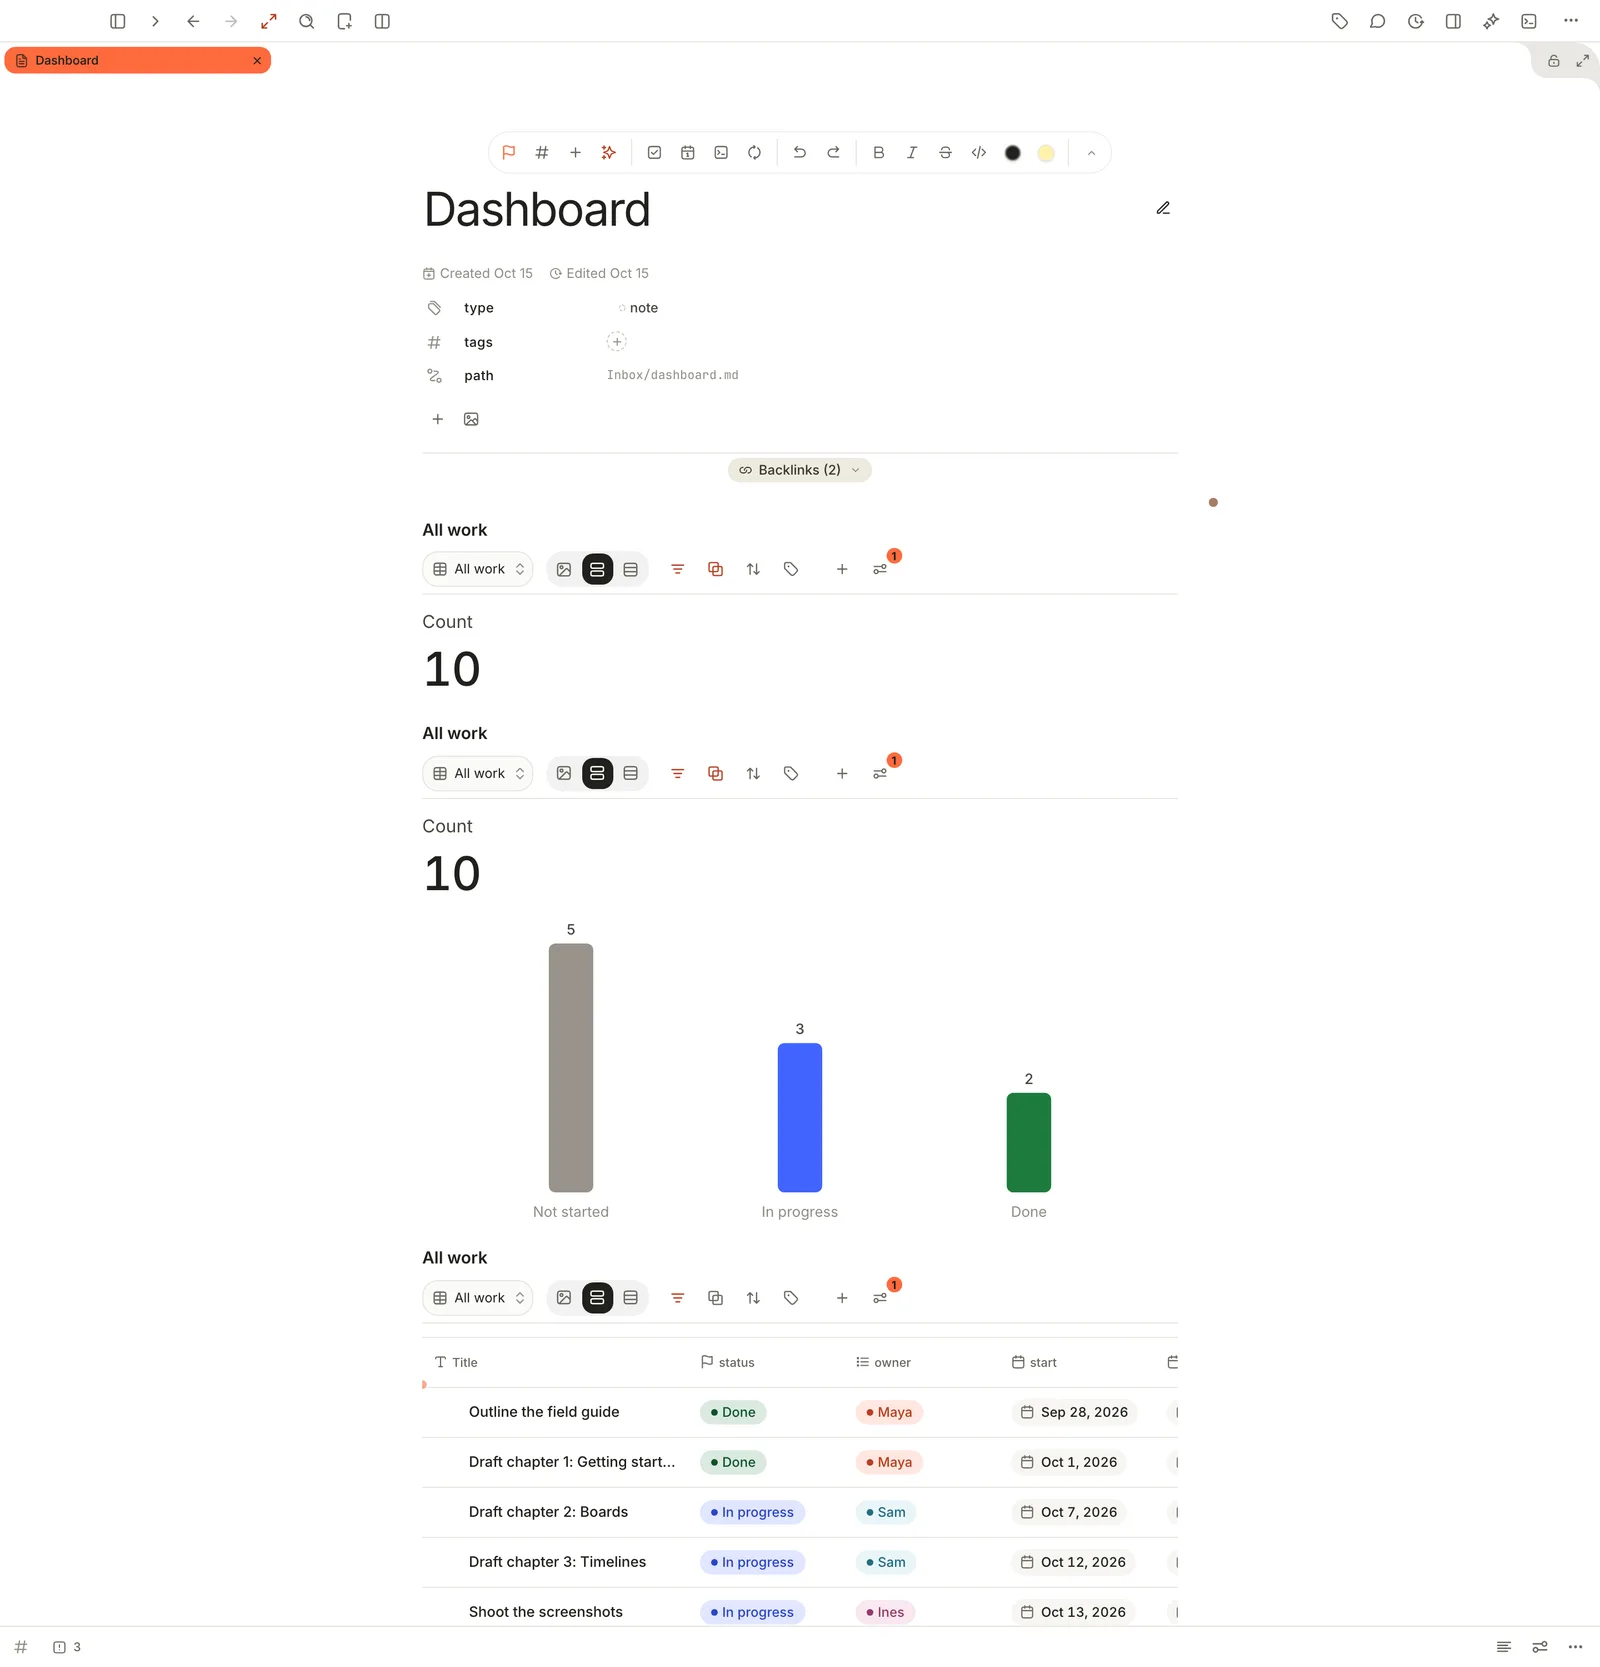
Each block looks through the database's current view, so a filter, sort or grouping you change in one block changes that view everywhere it appears. Only the template blocks' layouts and their number and chart settings stay with the block. A change shows straight away in the block you made it in, and in the other blocks the next time you open the dashboard; [Build a dashboard](https://terramd.io/docs/dashboards) has the details. Rename the note *Field guide — dashboard* and pin it to the sidebar rail.
> [!NOTE] Don't see the Dashboard template?
> Terra adds its starter templates to brand-new Libraries only. In an older Library, build the same page by hand: on an empty line type `/database`, press Return and pick the database. Repeat for each block, and switch each block's layout from its view menu.
## Step 8: Chart a burndown
A burndown plots how much work is left on each day, so you can see whether you'll land on time.
> [!WARNING] There's no built-in burndown chart yet
> Terra doesn't record when an item was finished, and database charts don't have a running-total mode. The recipe below gets you a real burndown using a query and its chart's **Cumulative** setting. The catch: you record a `completed` date yourself, and the chart's settings aren't saved with the query, so you set them again each time you open it.
**Record when work finishes**
1. Add a **Date** property called `completed` to the database (step 3).
2. Whenever you drag a card to **Done**, set its `completed` date. A table view sorted by `status` makes this quick.
**Build the chart**
1. Choose **File › New Query**.
2. Paste this into the editor, replacing `projects/field-guide/` with your project's folder (keep the trailing slash):
```sql
WITH items AS (
SELECT
date(n.created) AS opened,
(SELECT f.value_text FROM v_frontmatter f
WHERE f.note_id = n.id AND f.key = 'completed') AS closed
FROM v_notes n
WHERE instr(n.path, 'projects/field-guide/') = 1
),
events AS (
SELECT opened AS day, 1 AS change FROM items
UNION ALL
SELECT closed AS day, -1 AS change FROM items WHERE closed IS NOT NULL
)
SELECT day, sum(change) AS net
FROM events
GROUP BY day
ORDER BY day
```
Each item adds one on the day it was created and takes one away on the day it was completed. Added up over time, that's the number of items still open — your burndown, including any scope you add along the way.
3. Press ⌘ Return, or click **Run query** in the floating tools. The results appear as a table.
4. Click **View: Results** in the floating tools and choose **Chart**.
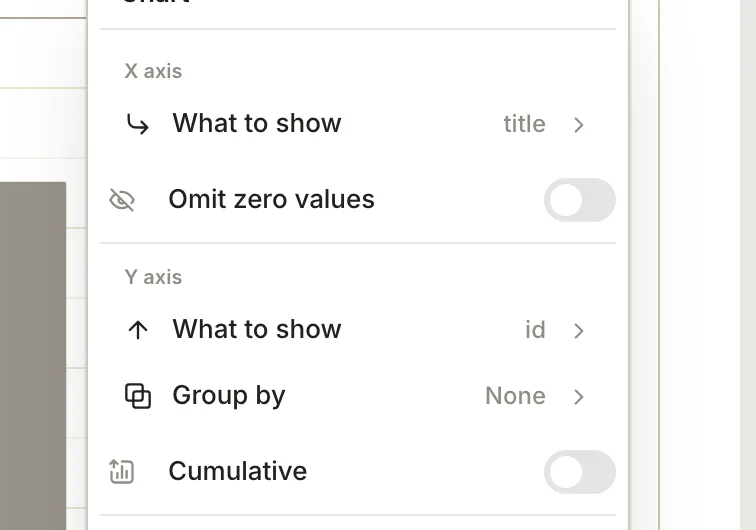
5. Pick **Line** from the chart-type menu, then click **Chart settings** (the gear):
- **X axis › What to show** — `day`
- **Y axis › What to show** — `net`
- Turn on **Cumulative**.
6. Click **Save query** and give it a name, so the SQL is one click away next time.
For an effort-weighted burndown, replace `1` and `-1` with the item's `effort` (from `v_frontmatter`, key `effort`, column `value_number`). For a burn-up of finished work, keep only the `completed` rows and count them.
## Features you might have missed
### Checklists inside work items
Each work item can hold its own checklist (`- [ ] Review`). Show the **Progress** property on any view of the database to see a small completion ring per item — a lightweight way to track sub-steps without more notes.
### A task board for the project's to-dos
If you write to-dos as checkboxes inside your notes, right-click **Tasks** in the sidebar and choose **New task database**. Name it *Field guide tasks*, then click **Sources** in its header and pick the `projects/field-guide` folder. You get a board of every checkbox in the project, in **Open**, **In progress**, **Done** and **Cancelled** columns. See [Run your week with tasks](https://terramd.io/docs/run-your-week-with-tasks).
### Roll work up into milestones
On the timeline, parent items can show the progress of their children. Add a **Thread** property (in **Add property**, under **Computed**) that links a milestone note to its work items, then in **View preferences › Dates** set **Children thread** to it, **Completion status** to **Status** and **Weight by Effort** to `effort`. Parents gain a progress bar, weighted by effort. Children must be in the same database.
### Status reports in one click
**View preferences › Save as Markdown note** freezes the current view into a dated note in your Inbox — a table you can paste into an update or keep as a record of where things stood.
### An intake form
Add a view with the **Form** layout and share the screen in a meeting: each submission becomes a new note with the fields you chose.
### Switch layouts instantly
Press ⇧ ⌘ V to cycle the current view through every layout — a quick way to see which one tells the story best.
## Troubleshooting
> [!NOTE]- A card I added from the board disappeared
> **+ Add note** puts new notes in your Inbox, which this database doesn't collect. Find the note in **Inbox** and move it into the project folder, or add work with **New note here** on the folder.
> [!NOTE]- The timeline says "No timeline dates"
> Open **View preferences › Dates** and set **Start** and **End** to your date properties. Until you do, Terra draws each note from the day it was created to the day it was last edited.
> [!NOTE]- Milestone progress counts nothing as finished
> Timeline progress treats an item as complete when its status is *Done* (or *Cancelled*). If you renamed your finished option — to *Shipped*, say — rename it back to *Done* in **Tools › Property Manager…**.
> [!NOTE]- Clicking Delete on a timeline bar removed my note
> **Delete** in a timeline or calendar popover moves the note itself to the Trash. Restore it from **Trash** with **Put Back**.
> [!NOTE]- The burndown chart lost its settings
> Query chart settings aren't saved yet. Reopen the query, choose **View: Results › Chart** and set the axes and **Cumulative** again.
## What's next
- [Build a personal dashboard](https://terramd.io/docs/dashboards) — more chart and stat-tile ideas.
- [Run your week with tasks](https://terramd.io/docs/run-your-week-with-tasks) — checkbox tasks, due dates and the calendar.
- [Find anything with search](https://terramd.io/docs/power-search) — find items across every project at once.